HorseyFun.com
Home
PostScript Applications
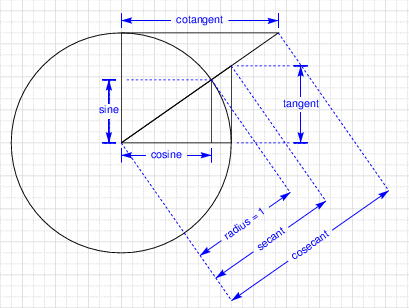
Here's a PostScript file that will generate the Unit Circle. This clearly displays the trigonometric functions in a graphical fashion.
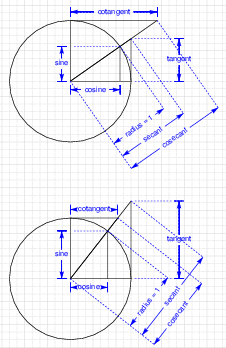
This file will generate two Unit Circles. Two different angles are used to graphically display how the trigonometric functions change.
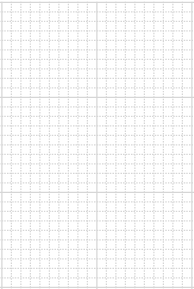
This file will generate a simple sheet of 10 x 10 graph paper. It is highly customizable, and you can generate many different linear graph papers by simply changing the variables that are near the top of the file.
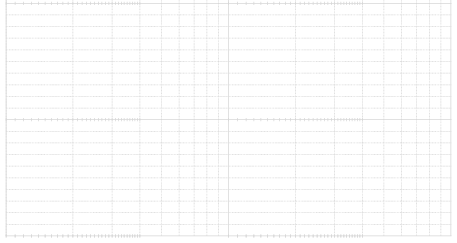
This file will generate a sheet of semi-log graph paper with a logrithmic x-axis. It is highly customizable, and you can generate many different semi-log graph papers by simply changing the variables that are near the top of the file.
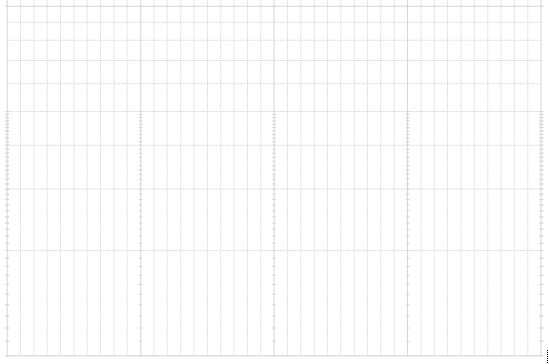
This file will generate a sheet of semi-log graph paper with a logrithmic y-axis. It is highly customizable, and you can generate many different semi-log graph papers by simply changing the variables that are near the top of the file.
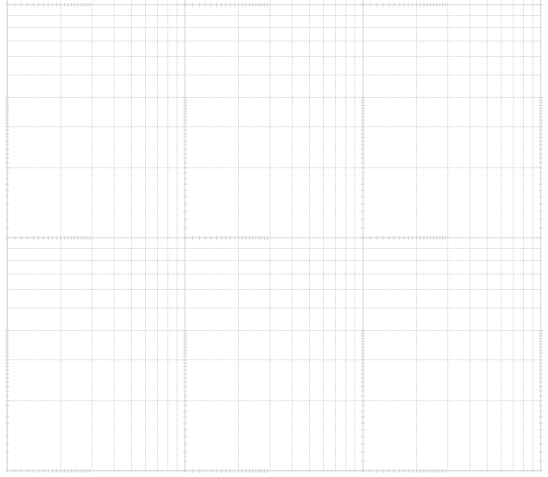
This file will generate a sheet of graph paper with logrithmic x & y axes. It too is highly customizable, and you can generate many different logrithmic graph papers by simply changing the variables that are near the top of the file.
Home